BALANCE OF PAYMENTS AND FOREIGN TRADE
Trade Balance
The trade balance shows the value of exported goods minus the value of imported goods. The gross domestic product (GDP) is determined as the production value minus the consumption of raw materials etc.
Figure 1
Development of Trade Balance in Relation to BNP in Per Cent
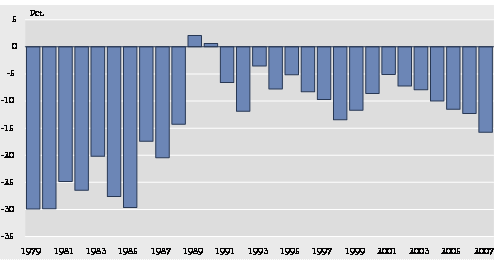
Note: The figures for 2006 are provisional.
Source: Statistics Greenland
Figure 1 shows the evolution of the trade balance since 1979. Between 1979 and 1988, there were significant trade deficits, reaching in some years as much as 30 per cent of the gross domestic product (GDP). This is primarily due to a prolonged boom in the fishing industry which caused a substantial import of products for consumption and consumer durables. The crisis in the fishing sector necessitated a tighter fiscal policy and a construction freeze. The slowdown of the economy as a whole led to smaller trade surpluses in 1989 and 1990. Since 1991, the trade balance has shown a deficit, although at a lower level, equivalent to 5-10 per cent of the GDP.
Balance of Payments
The balance of current transfers on the balance of payments is calculated as the difference between the total revenue and expenditure with regard to current transfers concerning non-resident entities.
Figure 2
Main Entries on the Balance of Payments
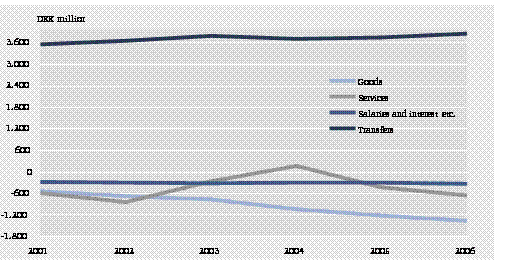
Source: Statistics Greenland
Figure 2 shows the development of entries for the years 2001-2006. More details are shown in Table 1. The dominant entry is transfer income which covers the block grant from Denmark as well as subsidies from the EU and Greenland's share of the profits of the National Bank of Denmark.
Figure 3
Distribution of Service Lines of Business in 2006
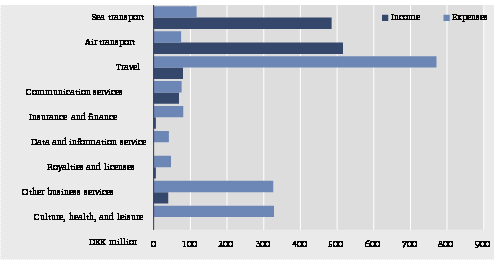
Source: Statistics Greenland
Figure 3 shows a breakdown of the service line of business in 2006. All items, except air and sea transport, showed deficits. The tourist balance showed the largest deficit, meaning that residents of Greenland used more money staying abroad than foreigners used staying in Greenland.
In recent years, the overall balance of payments has shown a surplus. The surplus has fluctuated between DKK 1.400 million and 600 million, equivalent to between 14 and 6 per cent of the GDP. The surplus was halved from 2004 to 2005, primarily due to rising costs of imports.
Figure 4
Surplus on the Balance of Payments in Per Cent of GDP
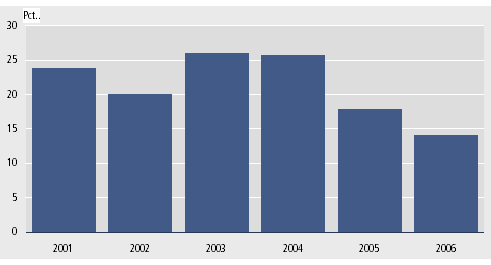
Source: Statistics Greenland
Figure 5
Development of Export and Import Quotas of Greenland
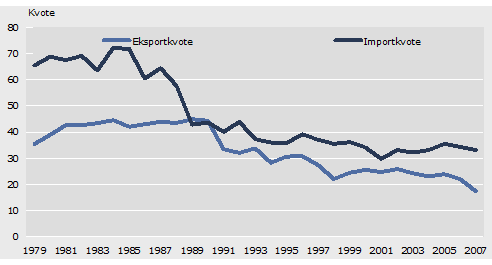
Source: Statistics Greenland